


Whether you make your living as a behavior analyst, a Hollywood studio executive, or a gambler, multipliers provide valuable information. For gamblers, multipliers state how much money will grow based on a bet. In Figure 1 below, the picture of the poker machine advertising shows how much money the person could win with the “Bonus Multiplier” if they “play max credits.” The 10x multiplier means that if a person bets $1.00, they could win $10.00 ($1 x 10 = $10).

Figure 1. Pictures from a video poker and slots machine.
The second picture in Figure 1 comes from a slots game and shows the “Bet Multiplier” the person selected. A “Bet Multiplier” of x1 means people win whatever they wager. A ¢50 bet x1 returns ¢50 (¢50 x 1 = ¢50). By the way, the payout of $0.00 nicely demonstrates what happens most of the time people bet slots!
Multipliers also help Hollywood studios determine their return on investment. Crazy Rich Asians and Peppermint represent two movies with contrasting returns. Crazy Rich Asians cost $30,000,000 (30 million) to make and made approximately $171,000,000 in gross revenue. On the other hand, another studio spent $25,000,000 to make Peppermint and generated $35,000,000.
The multiplier for Crazy Rich Asians came to x4.9. Peppermint had a multiplier of x1.4. The comparison of multipliers quickly and easily allows studios and other interested parties to immediately understand the magnitude of growth.
Hollywood pays so much attention to multipliers due to information regarding initial investment. Compare two movies; Movie 1, an indie film that costs $2,000,000 and makes $10,000,000. Movie 2, a $200,000,000 spend for a superhero movie that returns $250,000,000. A casual observer might conclude Movie 1 ($8 million return) did far worse than Movie 2 ($50 million return). However, multipliers tell a completely different story. The studio immediately sees Movie 1 returned 5x (5 times the initial investment) while Movie 2 had a disappointing x1.25 (or 1.25x). How much things grow fall in the domain of the multiplier.
Multipliers for Professionals who Care about Growth
The power of clarity through quantification (e.g., multipliers) eludes many people who work with clients with autism and other disabilities. The problem stems from the tools available in the profession. Almost everyone who conducts single case experimental design (research) or applies an intervention in a service capacity (applied) employs a non-standard linear graph.
A linear graph does not lend itself to visually displaying multiply relationships. After all, the linear graph has an explicit construction design geared towards showing the absolute amount of change or how much more or less the behavior changes. Linear graphs lead to linear thinking. But as Jeff Bezos famously said, “We change our tools and then our tools change us.”
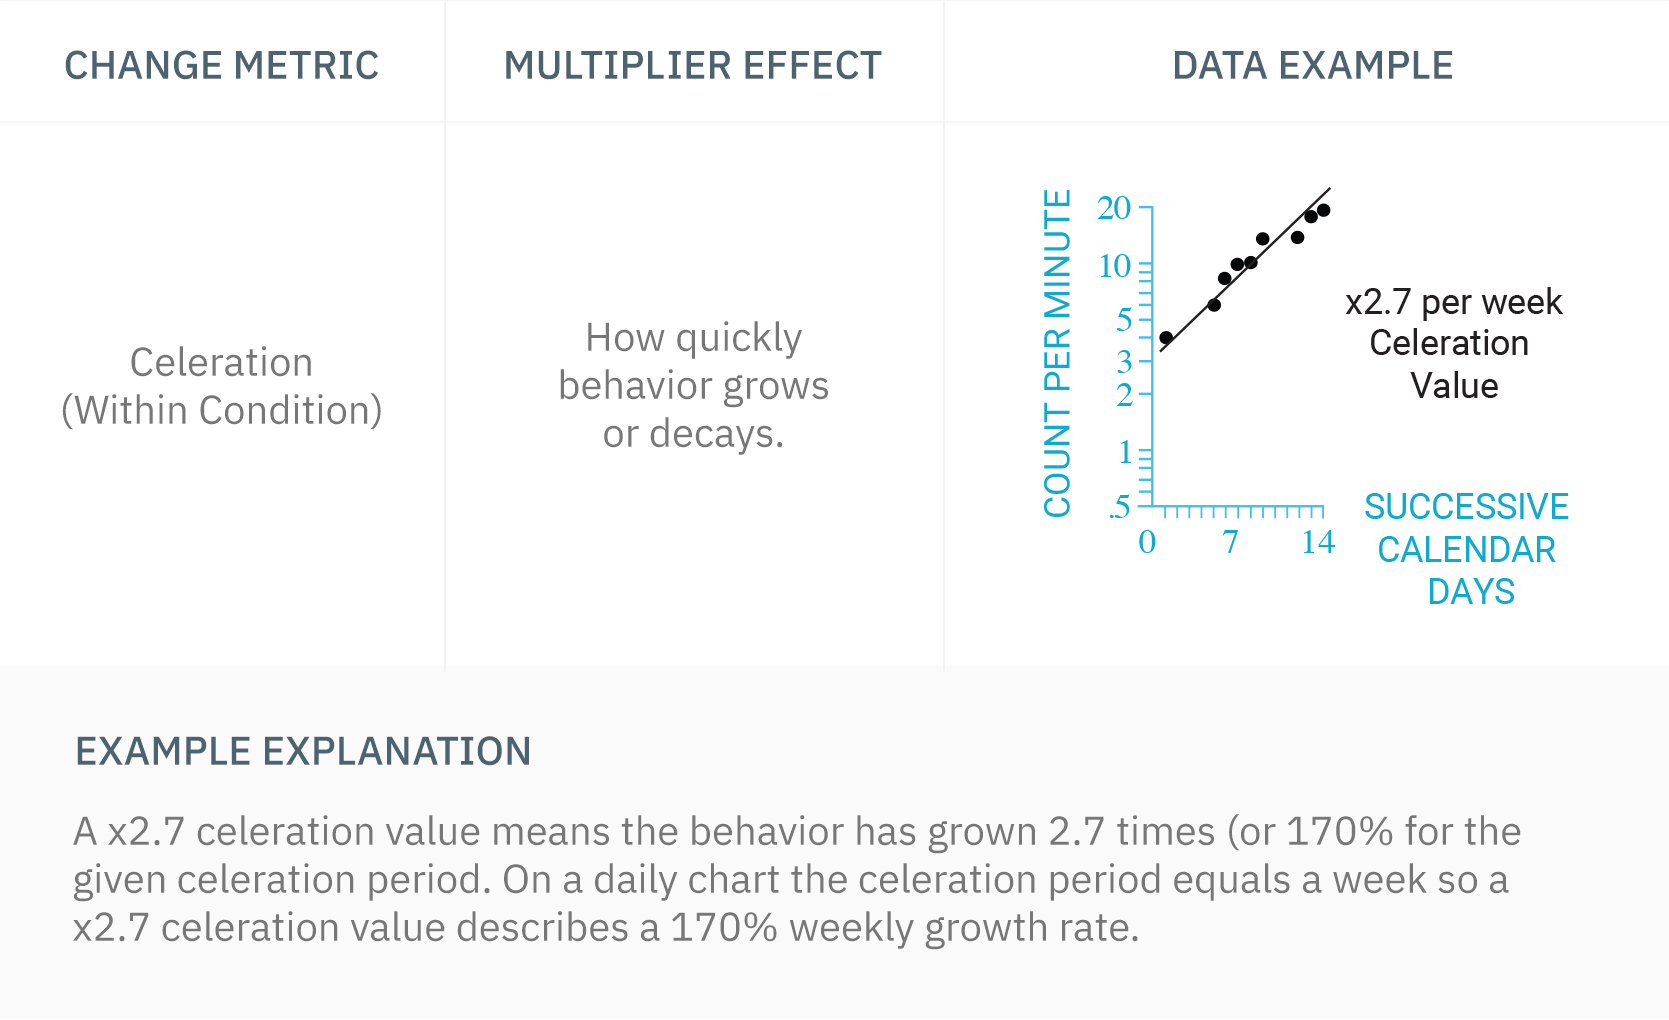
Table 1 below offers four examples of multipliers in action. The first item to explore is under the “Change Metric” section. In these examples, note that the red line in example #4 and #3 indicate a change in condition, such as new intervention.
Example #1
Example #2
Example #3

Example #4
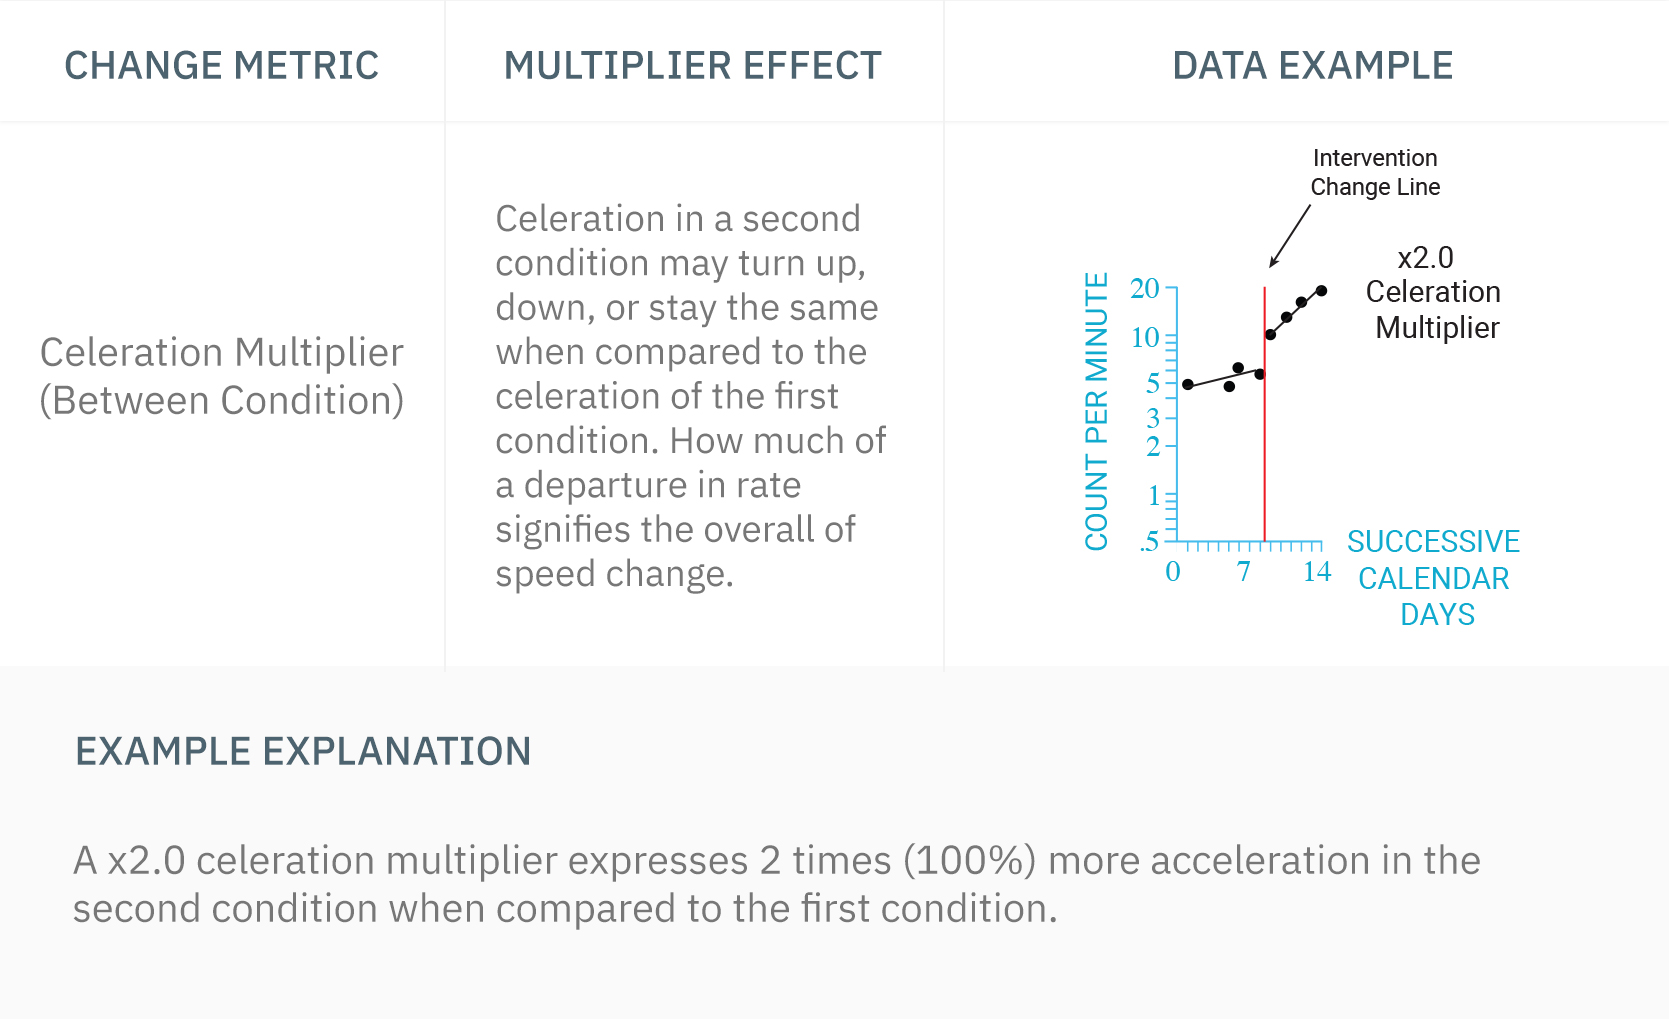
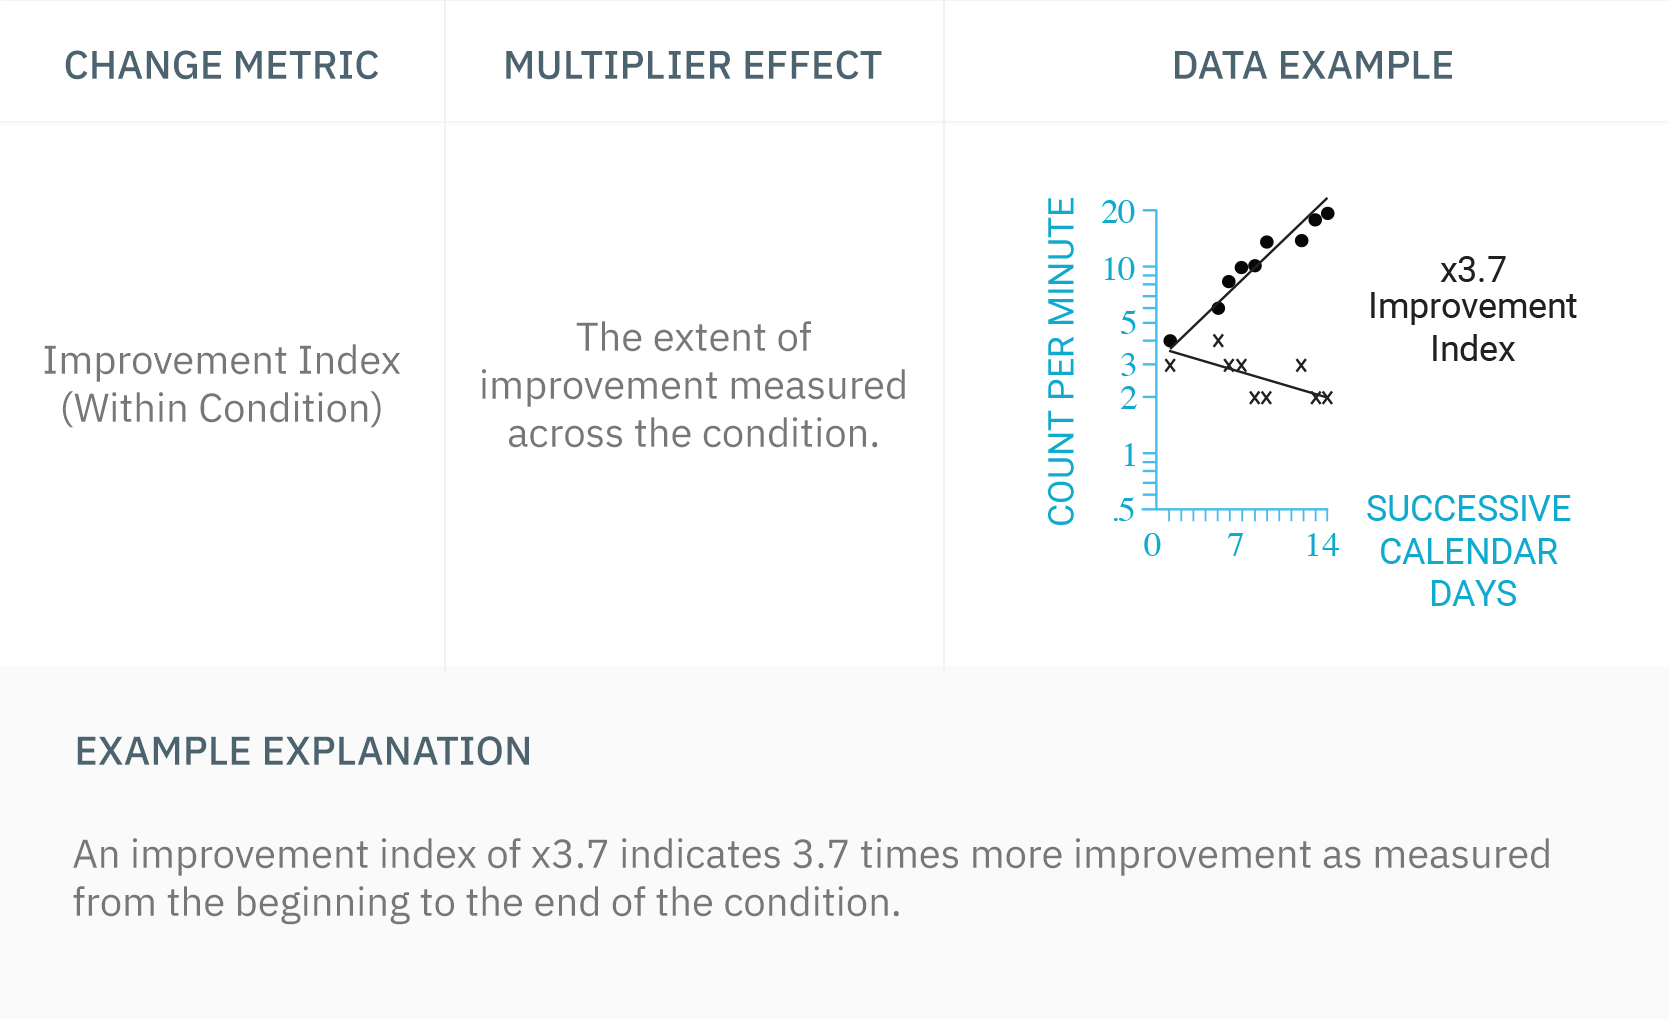
Table 1. Four change metrics, the multiplier effect, and examples.
Change metrics describe the change of interest and when it applies. Namely, does the metric involve change happening within a condition or between two conditions?
The four change metrics appear broken down and divided into two types (Table 1): Within condition analysis, and between condition analysis. Both types answer specific questions. What effect would a behavior change professional like to see within a condition? Celeration deals with the speed change in a condition. The improvement index reports on the degree of improvement that occurred within a condition.
Between conditions analyses, or moving from one condition and then examining what happens in the second condition, has two effects:
- How much impact did the addition or removal of the second condition have (i.e., answered by the frequency multiplier)?
- How much faster does change take place upon the removal or the addition of the second condition (i.e., domain of the celeration multiplier)?
All of the metrics provide a broader and more contextual picture of the change that happened. A BCBA or educator eager to evaluate the impact of an intervention instantly sees complex data transformed into digestible metrics.
What specific benefits do the four change metrics provide? Table 2 communicates what information behavior change professionals could potentially leave on the table.
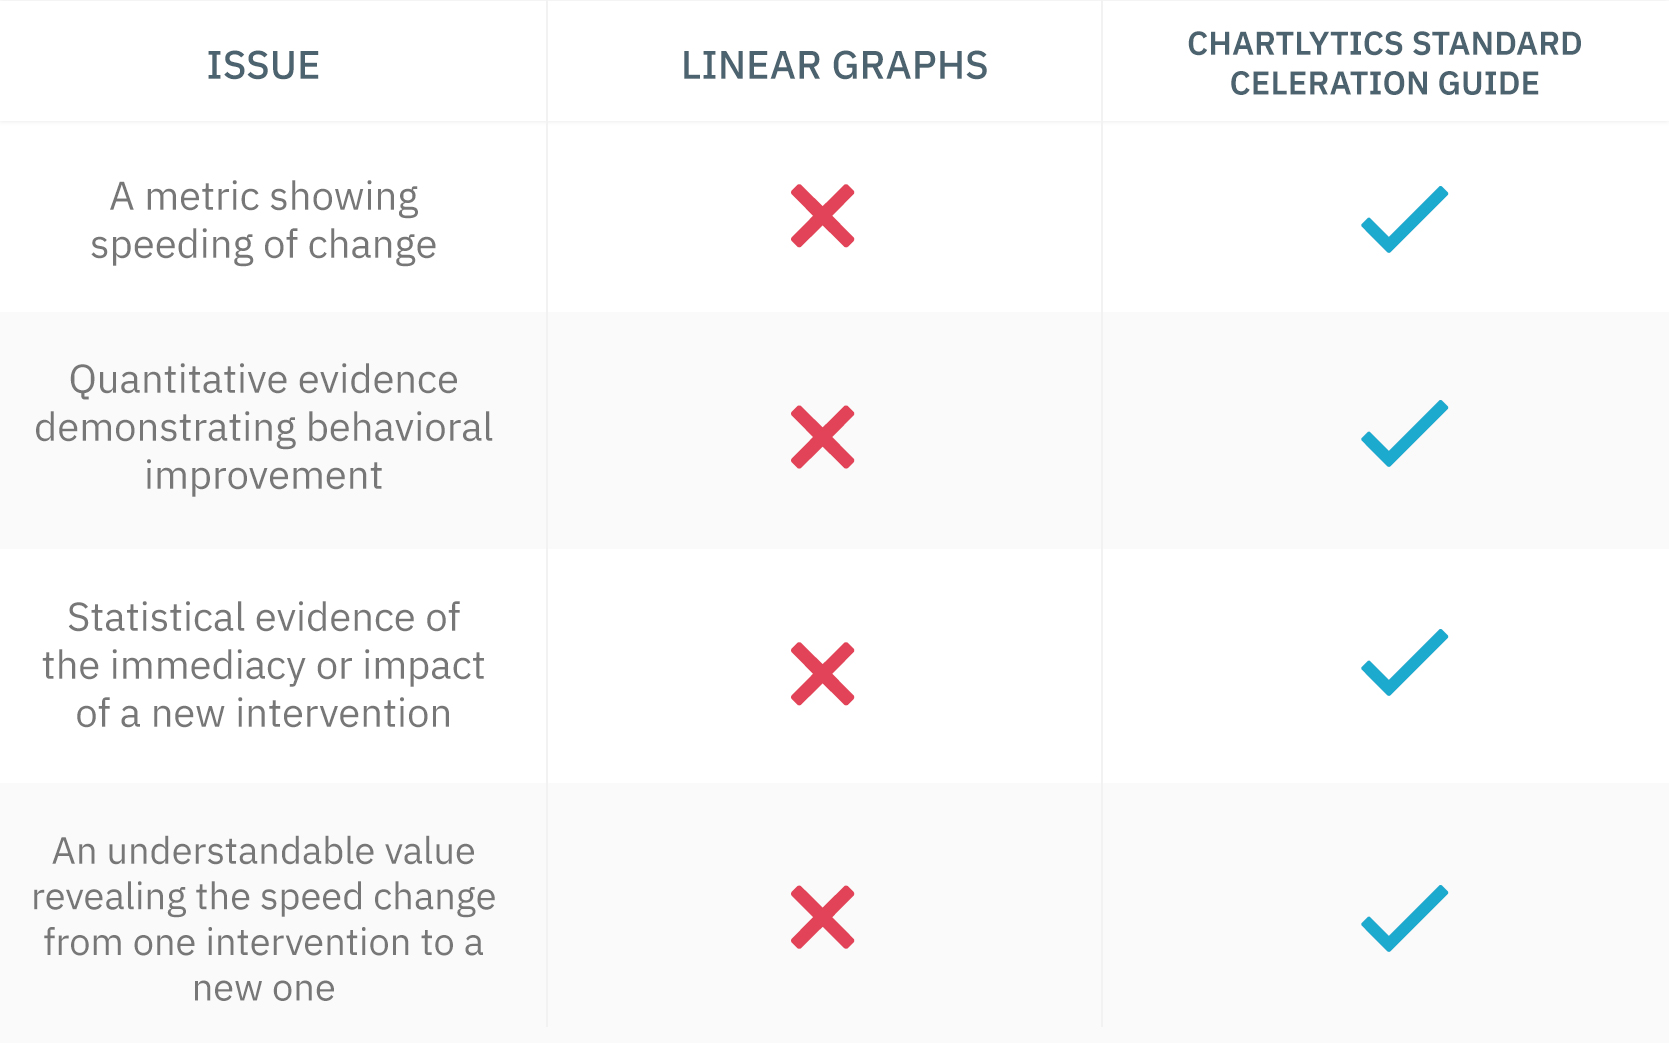
Table 2. Comparison of linear graphs and Chartlytics’ Standard Celeration Chart
Conclusion
Multipliers have great value in business, science, and the practice of behavior analysis. Like a Hollywood studio laser-focused on understanding profits, behavior analysts can leverage change metrics that convey the extent to which a behavior changed along specific dimensions (e.g., speed/celeration or improvement index). By quantifying behavior effects, BCBAs and educators may assess programmatic changes for all clients. And if the change metric (i.e., multiplier) does not meet the threshold of a meaningful effect, the behavior change professional will take action by changing and implementing a new personalized intervention.
Rick Kubina Jr., Ph.D., BCBA-D
Director of Research, CentralReach