


By Rick Kubina, Ph.D., BCBA-D
CentralReach Director of Research
I began my college experience as a freshman psychology major at Youngstown State University (YSU) in 1985. As a first-year university student, I felt I really did not know much about anything. My goals centered on helping children and I had big dreams of becoming a clinical psychologist.
The psychology program at YSU had an eclectic mix of faculty. Some focused on social psychology and clinical psychology, while others taught general and educational psychology. The backgrounds of the faculty also varied with some espousing cognitive, Freudian, and behavioral theories.
In 1986 I had my date with destiny. A class called “Introduction to Learning” taught by Dr. Steve Graf would forever change my life. The class emphasized learning, but through the lens of something called “Precision Teaching.”

Figure 1. A picture of Dr. Steve Graf and myself at my graduation party.
In 2019, I find myself with a different job than my early dreams of clinical psychology. Yet, I did not lose my passion to help children and have channeled my efforts through research, outreach, and consultation. Thirty-four years later, I find myself following in the footsteps of my mentor, Steve Graf, still critically examining Precision Teaching and sharing its groundbreaking results with the world.
Throughout my career, I have had interactions with thousands of students and professionals; occasionally, I will hear a misconception of Precision Teaching.
I would like to share the top 3 PT Myths I have heard over the last 5 years:
Myth #1: Implementing Precision Teaching means “going fast.”
“Going fast” stems from a concept called behavioral fluency. Behavioral fluency refers to the “fluid combination of accuracy plus speed that characterizes competent performance” (Binder, 1996, p. 164). As an example of behavioral fluency, a child would imitate one-step gross motor actions at 8 correct and 0 incorrect per 10 seconds. Another example involves a middle school keyboarder who types 60 words correct, with 0 incorrects, in 1 minute. In both instances, a person executes a behavior with high accuracy and speed. Research shows that when someone attains the level of behavioral fluency, several critical learning outcomes co-occur like retention, endurance, and maintenance (Johnson & Street, 2013).
Behavioral fluency has received a great deal of attention from behavior analysts because of its many positive effects. Recent studies demonstrate the wide-ranging effects such as nurses becoming fluent and generalizing their ability to perform venipuncture, helping staff at residential homes learn, implementing behavior support plans smoothly and accurately, and enhancing 9 to 11-year-old students’ grade level math.
“Going fast” or performing a behavior at a pace considered natural and automatic represents part of the behavioral fluency concept. However, Precision Teaching (PT) involves a four-step process: Pinpoint, Record, Change, Try Again. The following figure shows the four steps and briefly describes what each entails.
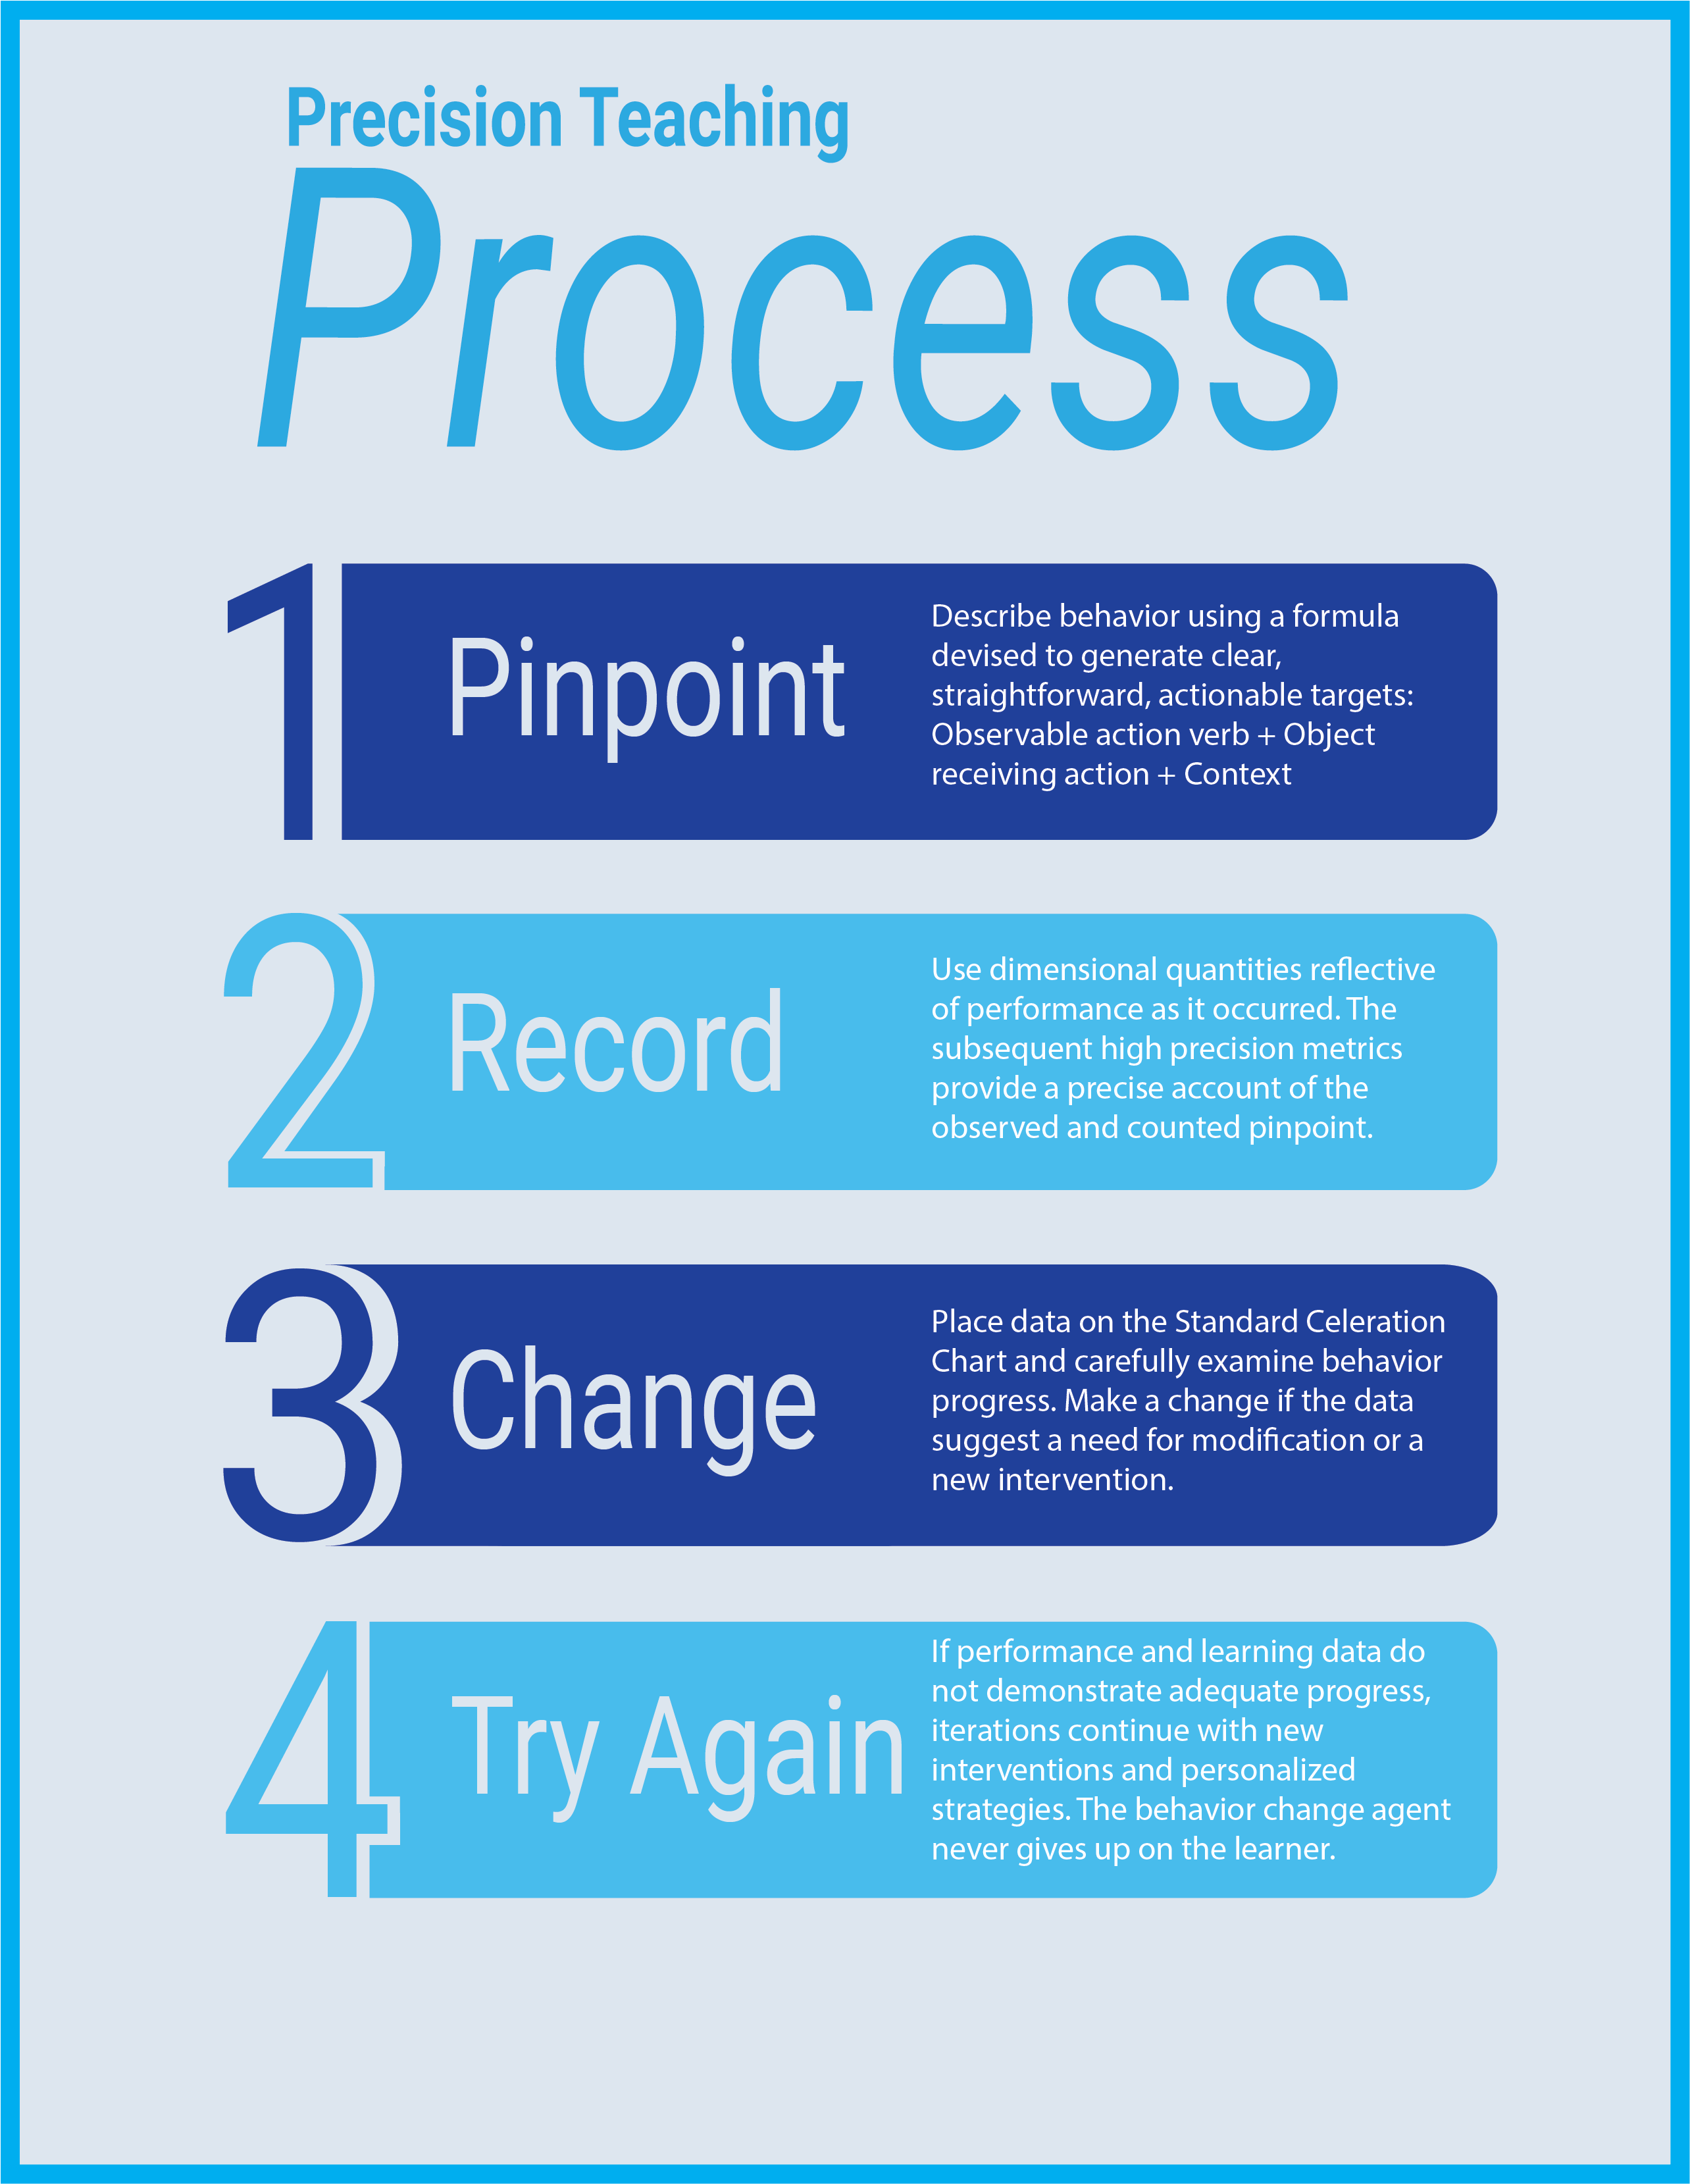
Figure 2. The four-step process of Precision Teaching from The Precision Teaching Implementation Manual (2019).
Behavioral fluency emerged from the application of PT and its emphasis on the continuous recording of behavior in shorter time frames (e.g., one minute). Well over 40 peer-reviewed publications demonstrate the effects of behavioral fluency. Behavioral fluency studies began with PT and at times, some people equate the concept and measurement system as the same. Any behavior change agent can apply PT without invoking behavioral fluency or trying to get the client to “go fast.”
Myth #2: I don’t need to learn about Precision Teaching because the Behavior Analyst Certification Board (BACB) took it off the exam.
Certification occurs so that professionals possess a level of competency that allows them to effectively practice their craft in a targeted field. Just like Accountants can become Certified Public Accountants by passing the Uniform Certified Public Accountant Examination, behavior analysts can become Board Certified Behavior Analysts (or BCBAs) through supervised experience and passing an examination.
The establishment of the BACB marked a turning point for the field of behavior analysis, and the field grew at an astonishing rate. The Standard Celeration in Figure 3 displays the change of BCBA certifications depicting a 90 percent growth rate of BCBAs every five years! If the celeration remains true, by 2023 over 100,000 BCBAs will swell the ranks of certified behavior analysts.
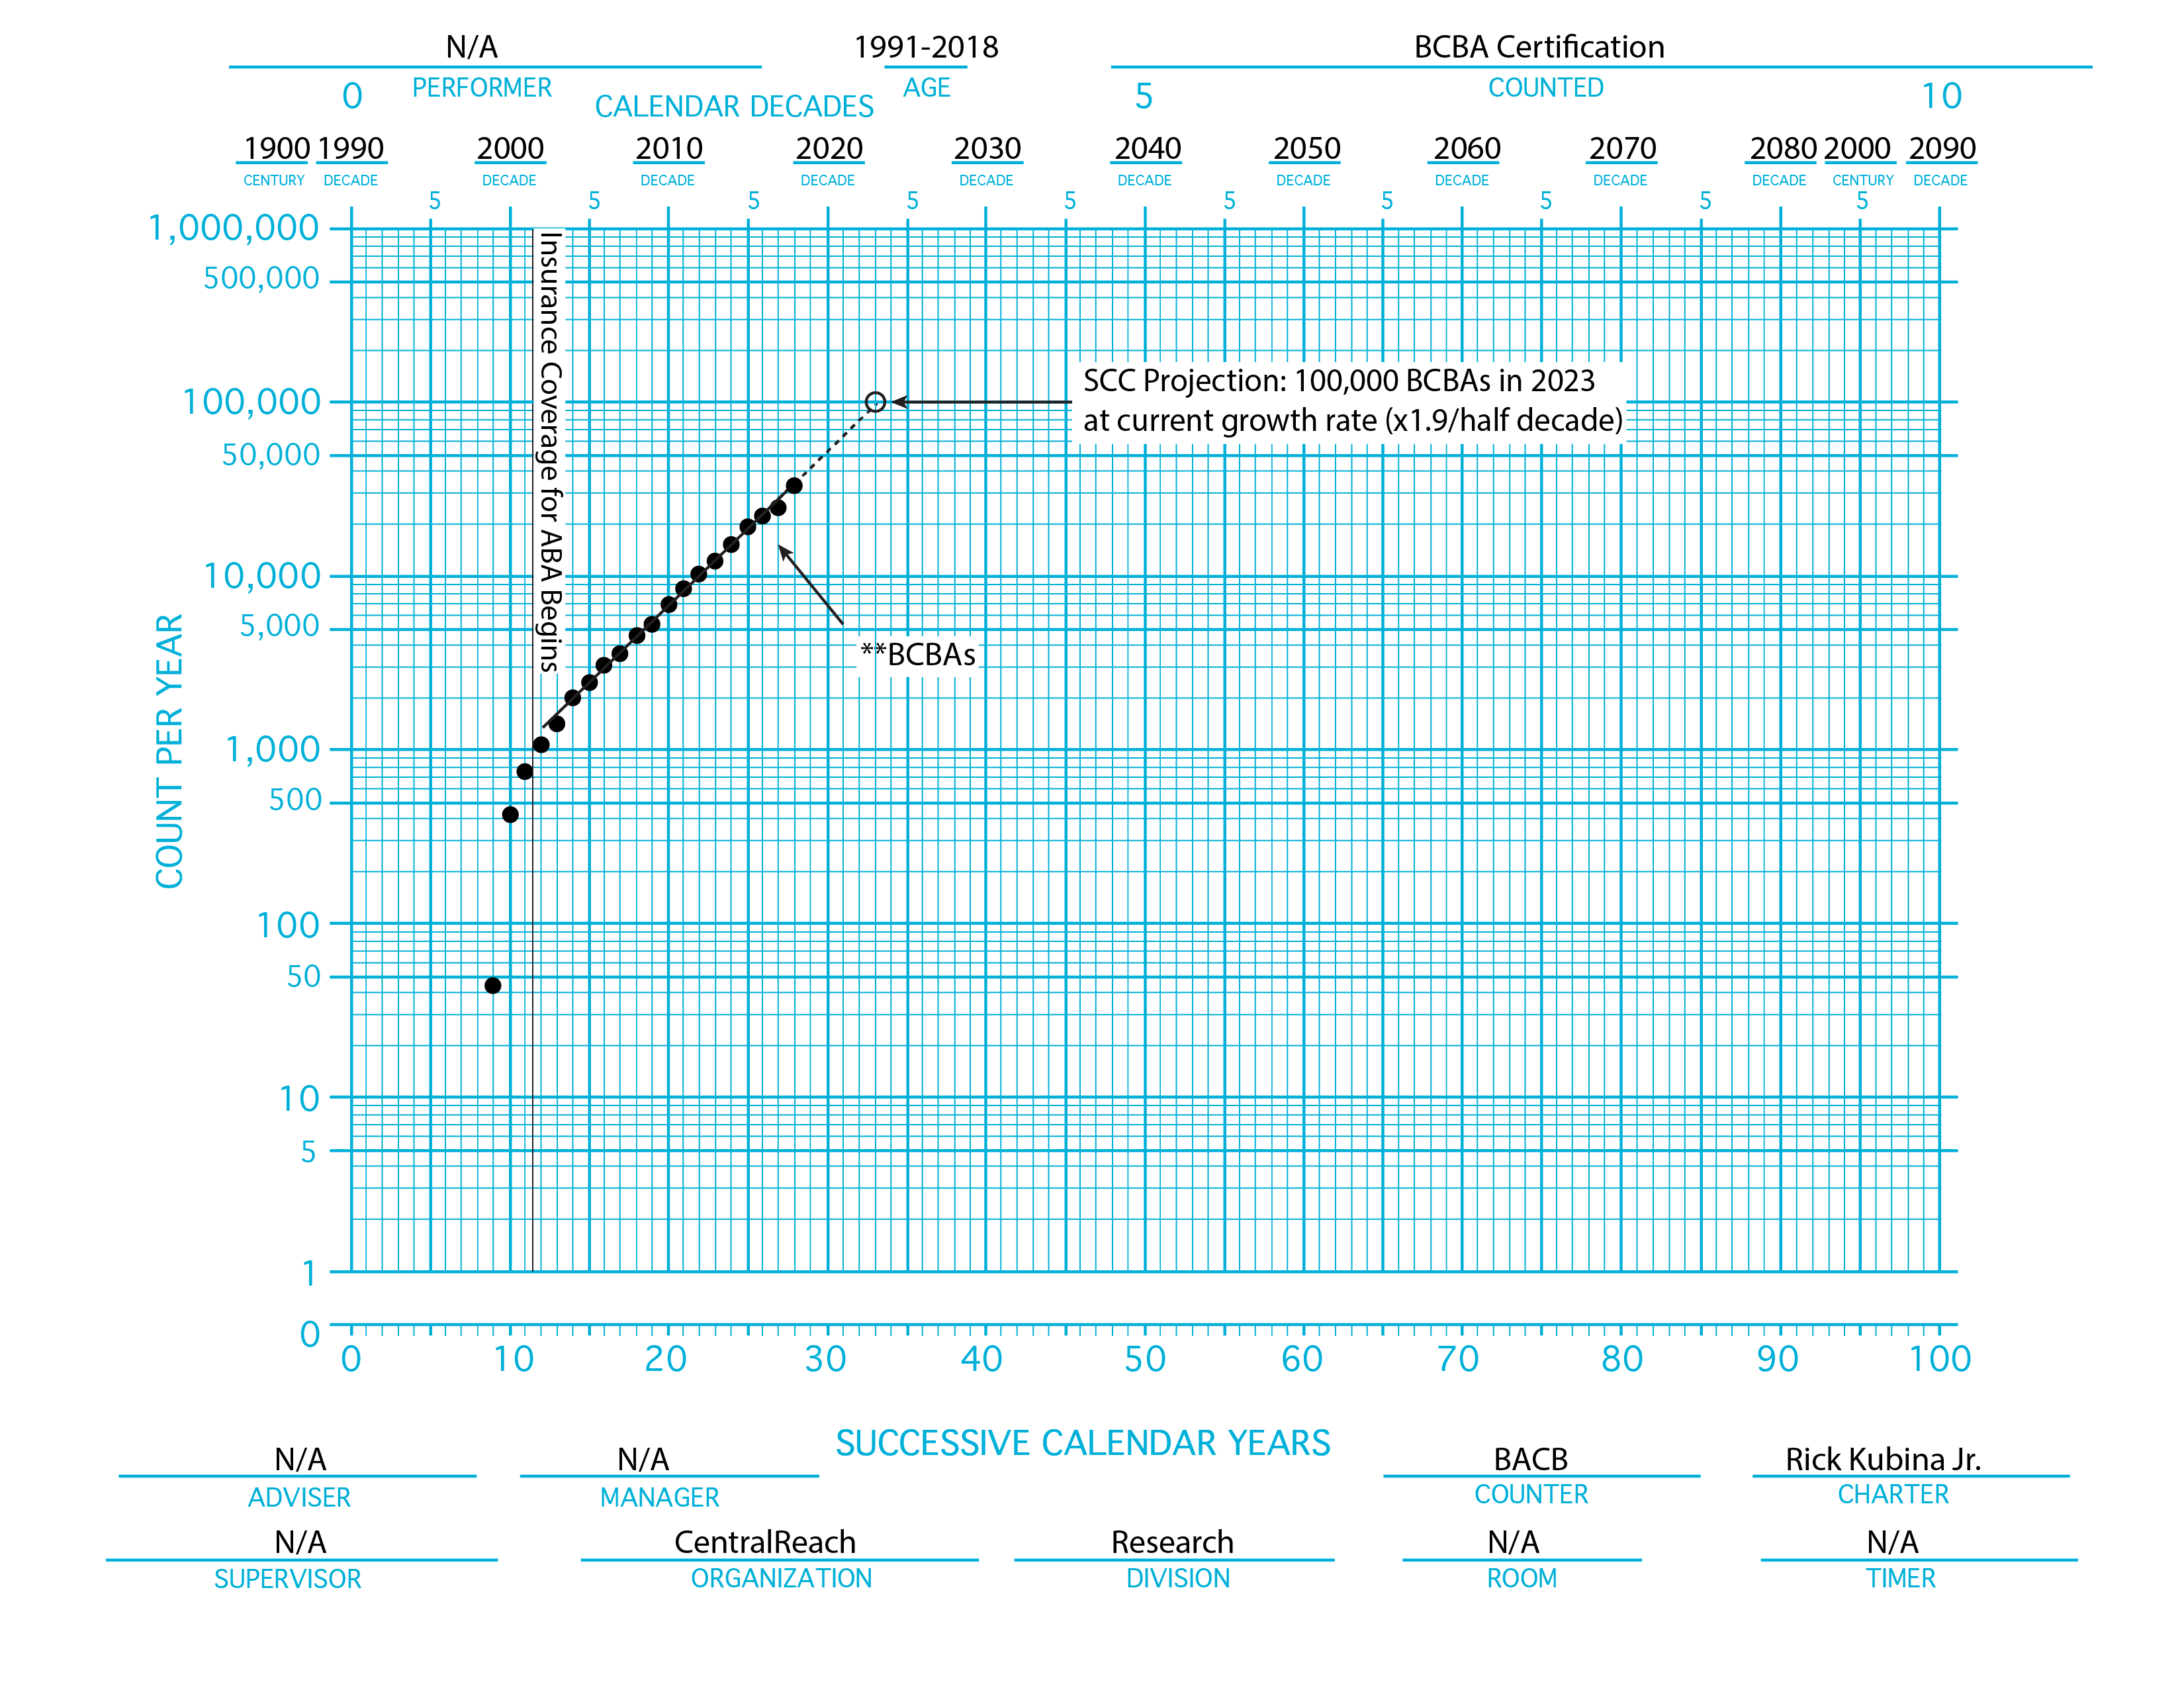
Figure 3. A Standard Celeration Chart showing BCBA growth across time.
According to its bylaws, the BACB “is to protect consumers of behavior analysis services worldwide by systematically establishing, promoting, and disseminating professional standards.” Therefore, the board establishes what it deems appropriate for its standards. The standards then appear in a Task List forming the foundation of critical content and examinations of competence.
The process for determining what goes on the Task List and the exam involves a combination of surveying current practices from active professionals and a group of professionals from the BACB carefully examining survey data and discussing what best represents essential information for behavior analysts.
The fact that the BACB no longer requires knowledge of Precision Teaching or Standard Celeration Charting on an exam does not speak to the validity or utility of either. The decision reflects a continual revision process whereby the BACB continuously strives to determine the best task list possible. Namely, one they feel best represents critical competencies for behavior analysts.
As a long time researcher and practitioner of behavior analysis and Precision Teaching, I believe all behavior analysts should incorporate PT in their practice because it provides a framework for labeling data; enhances data targets through “pinpoints”; creates a standard of universal measurement; quantifies data and research; and has countless other benefits for practitioners in the field.
The fact the BACB removed PT information in a behavioral competency examination should not dissuade exploration, study, and possible adoption of the system. Practicing and future behavior analysts should decide to learn about and use Precision Teaching based on the merits of what it has to offer in regards to measurement and decision making.
Myth #3: Precision Teachers say everything needs to go on the Standard Celeration Chart.
Several aspects of Precision Teaching advance precision. Pinpointing behavior provides a precise label for behavioral detection and communication. Dimensional quantities like frequency (a.k.a. rate), duration, and latency each have precise values. But the Standard Celeration Chart (SCC) powers the Precision Teaching system and augments precision with a standard visual display.
Precision Teachers use the SCC with “time series data.” Time series simply means data occurs through some unit of time. Hourly, daily, weekly, or monthly data fall under the domain of time series analyses. Some questions answered by time series analysis include: “Has my data changed across time? How much has my data changed across time? Will my data continue to change across time?”
The SCC has a ratio scale that best suits time series data. Ratio scales have the specific purpose of displaying how fast behavior changes and like the SCC, sometimes go by the moniker “rate of change chart.”
Precision Teachers advocate the SCC when used with time series data. However, other visual displays can help behavior analysts and other behavior change agents understand their data.
Relational graphics. Relational graphics show a relation between two variables. For instance, a correlation between the number of cigarettes a person smokes each year and lung cancer. The data would not appear on a Standard Celeration Chart. Instead, the correlation would populate efficiently on a visual display that has dual equal interval vertical axes and a horizontal axis with time (Figure 4).
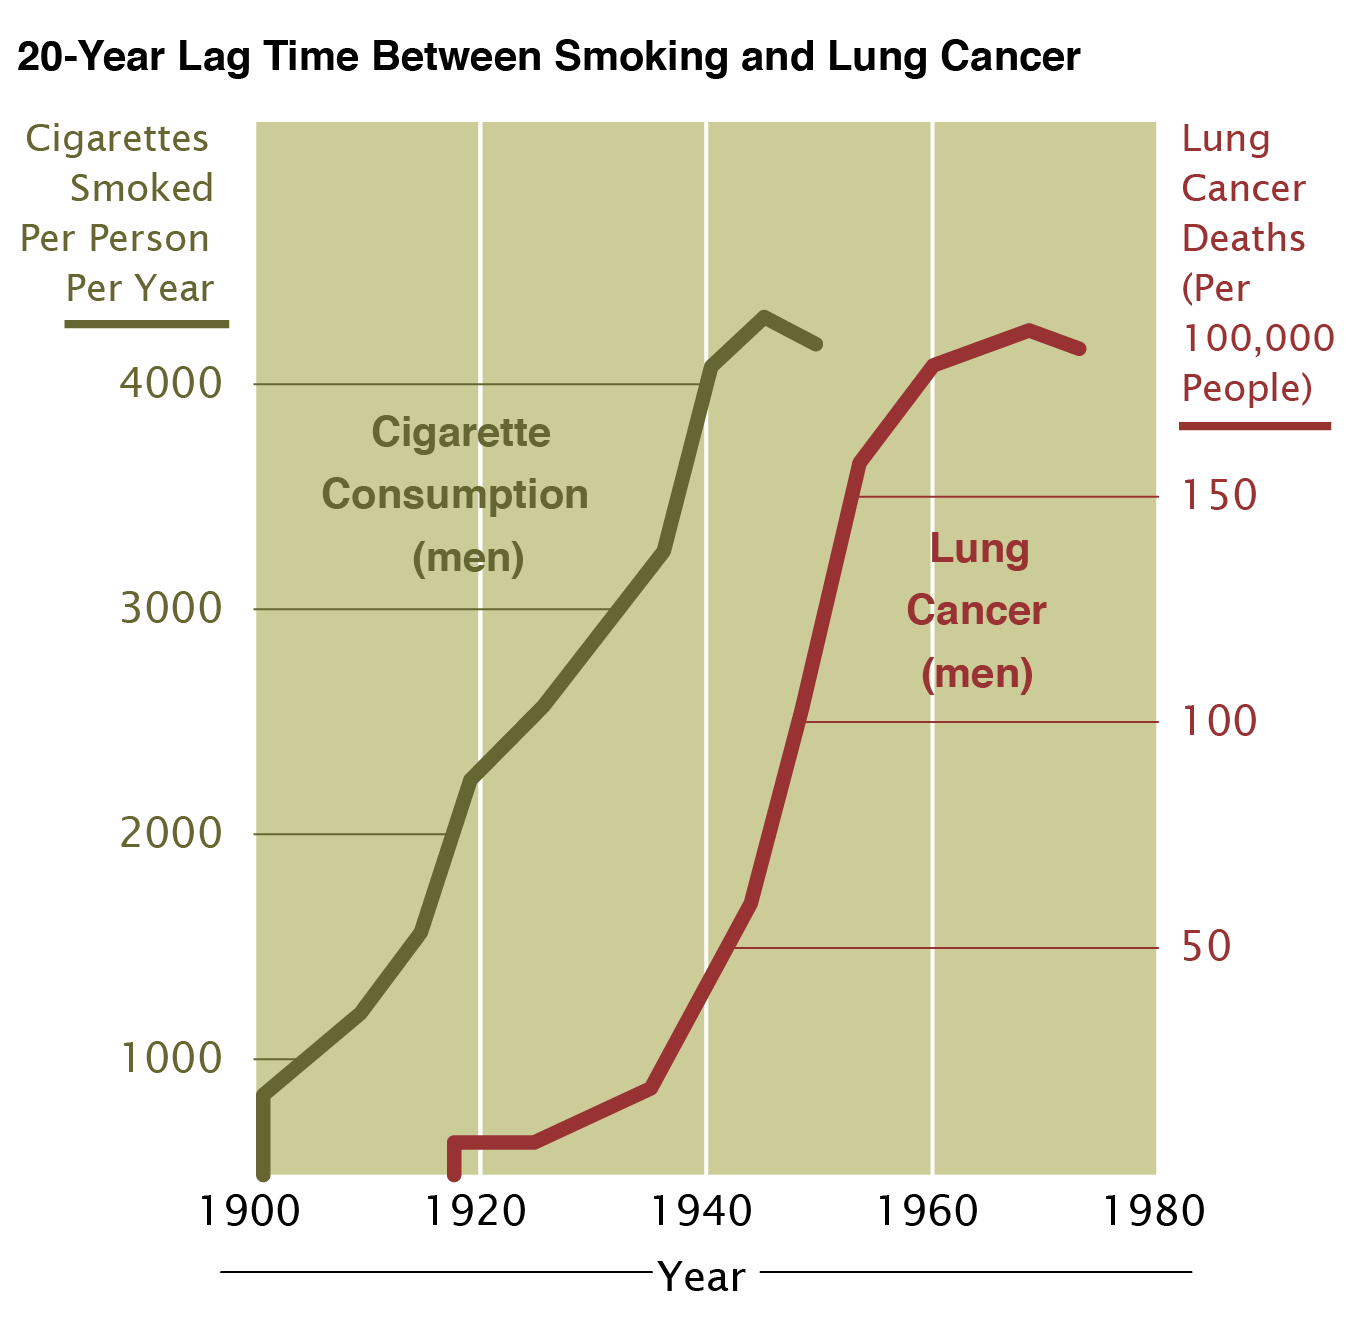
Figure 4 from Wikimedia commons correlating lung cancer and smoking.
A scatterplot offers a useful relational graphic used in behavior analysis. A 1985 article titled “A scatter plot for identifying stimulus control of problem behavior” effectively demonstrated how a visual display other than time series graphics could provide insightful information.
The scatter plot shows the occurrence of “assaults” across hourly time intervals. If Joan had one assault in 30 minutes, the data appeared as a square. Instances of two or more assaults, a circle. The data in Figure 5 shows a heavy concentration of assaults taking place between 1 and 4 PM on weekdays. It turned out the highest number of assaults tended to occur during prevocational and community living classes. The visual information allowed Touchette et al. to better configure Joan’s schedule and modify activities, thereby reducing assaults and helping Joan live a better life.
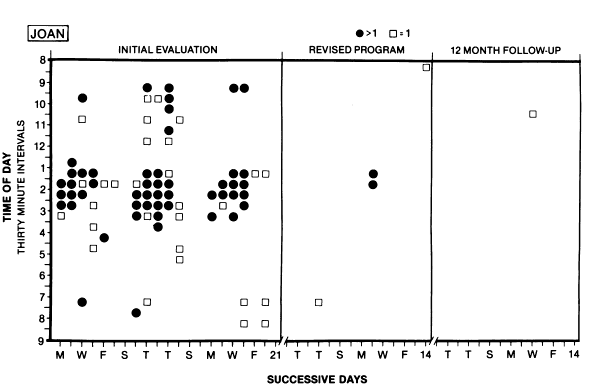
Figure 5. A scatter plot from Touchette, MacDonald, and Langer (1985)
When it comes to behavior changing across time, Precision Teachers use a Standard Celeration Chart because of its physical properties that enhance data analysis and decision making.
Conclusion
Precision Teaching has a strong evidence base with thousands of articles in peer-reviewed journals in behavior analysis, education, social work, sports psychology, and a multitude of other fields. PT concerns itself with precision measurement, actionable insights, and high-quality decision making.
About the Author

Richard M. Kubina Jr., Ph.D., BCBA-D is a Professor of Special Education at The Pennsylvania State University and teaches courses on methods for teaching reading, behavior analysis, and experimental design. Rick conducts wide-ranging research in the area of Applied Behavior Analysis and Precision Teaching. He also served as the editor of the Journal of Precision Teaching and Celeration. Rick has dedicated his professional career to helping behavior change agents such as teachers, behavior analysts, and other helping professionals efficiently change behavior through effective teaching and measurement such as Precision Teaching. Rick co-founded a software called Chartlytics. Chartlytics merged with CentralReach where Rick has assumed the role of Director of Research. At CentralReach, Rick explores how technology can accelerate superior outcomes for all those seeking to engender professional and personal success.

