


By Rick Kubina, Ph.D, BCBA-D , CentralReach Director of Research
At the time of writing this blog, a headline on CNN reads: “Dow sinks below 23,000, Nasdaq flirts with a bear market and oil is in free fall.” The Dow Jones Industrial Average (DJIA) and Nasdaq both represent important stock exchanges. In fact, many people consider the DJIA as a financial barometer of the world. Therefore, the Dow taking a dramatic downturn makes the mainstream news and causes headaches and worry for investors.
The DJIA has 30 stocks from United States companies. For many years, the Dow had a simple calculation: summarize the stock prices of all companies and divide by the number of companies in the index. For example, the Dow started with 12 companies and if all of their companies stock price combined to $10,000, then the average would come to 833.33 ($10,000 ÷ 12). Now, the Dow uses a more complicated weighted average. But what does the Dow and index calculations have to do with behavior?
The Improvement Index
An index serves as an indicator of something. As discussed previously, the Dow and the Nasdaq indicate how well the stocks in their portfolio perform. Investors have a quantifiable figure to gauge the “health” of the market. Unknown to many behavior analysts, there exists a quantifiable figure to determine how much improvement occurred over time.
“Improvement” cuts across all ages, occupations and positions. Elementary school students, college athletes, professional musicians, and surgeons all engage in behaviors that may improve or deteriorate.
Take the example of a basketball player shooting free throws. The player who shoots from the free throw line has a number of corrects (balls through the hoop) and incorrects (balls not through the hoop). A traditional measure of skill would appear as a percentage. For instance, 15 shots correct and 5 shots incorrect = 75%. Improvement, then, would occur if the accuracy went beyond 75%.
However, increases in accuracy from one data point to the next provide only a simple conception of improvement. Namely, that of the person becoming more accurate. The Improvement Index evokes a much greater appreciation for skill development.
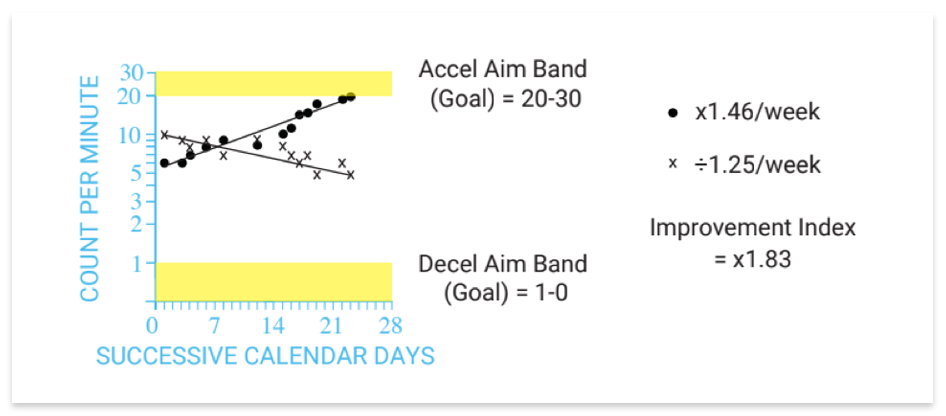
The following data shows a high school player, Mack, who practiced shooting free throws. Mack shoots as many balls as he can in a one-minute counting time. The data shows a rich display of information across time and the dots represent corrects and the X’s incorrects.
Figure 1. A standard Celeration Chart segment showing corrects and incorrects for shooting free throws.
A behavior analyst could also view improvement by looking at the Standard Celeration Charted data for other data features:
1. The direction of corrects and incorrects. Do they trend towards the aim or goal?
2. The speed at which each data path changes. Does the speed with which accel (corrects) and decel (incorrects) data change meet acceptable thresholds?
The data in Figure 1 reveal that both data paths move in the direction of the aim band. Furthermore, across time the corrects accelerated 1.46 times per week (a 46% weekly growth rate) while incorrects decelerated by ÷1.25 (or decayed by 20% each week).
A very sophisticated way to discern how much enhanced value happened falls in the domain of the Improvement Index. The Improvement Index takes into account the celeration value for the corrects and incorrects and then forms a ratio. The resulting value directly quantifies the degree to which a behavior became better or worse.
Mack’s x1.83 Improvement Index communicates the extent to which his free throw shooting improved. Stated differently, Mack’s ability to shoot free throws in practice improved by 83%. Just like the Dow Jones Industrial Average, the Improvement Index combines data (growth and decay rates across time) to provide a barometer for behavioral improvement.
With the Improvement Index behavior analysts can (1) quantitatively assess improvement or deterioration, (2) objectively compare improvement across people, and (3) have a scientific standard for which all behavior analysts grade interventions in terms of the amount of improvement produced.
Conclusion
Analyzing behavior makes for an exceptionally challenging task. The task becomes even more taxing without ready, quantifiable markers of behavior change. The Improvement Index presents a means to monitor and judge how much a behavior advanced or progressed. With the Improvement Index behavior analysis may one day have benchmarks indicating socially significant improvement. Until then, every behavior analysis can put their data to work by displaying it on a Standard Celeration Chart and examining the Improvement Index.