

Albert Einstein famously said, “One thing I have learned in a long life: that all our science, measured against reality, is primitive and childlike — and yet it is the most precious thing we have.”
Einstein’s statement evokes feelings of humility and delight. Humanity’s understanding of nature and our place in cosmos has grown, yet fundamental questions and mysteries of the universe appear in every branch of science. On the other hand, people have managed to visit the moon, cure diseases that in the past plagued the world, and have engineered disease resistant crops saving millions from starvation.
Applying science to behavior has yielded a discipline called behavior analysis. B.F. Skinner founded behavior analysis by applying natural scientific methods to objectively study why organisms behave as they do. Skinner focused behavior analysis on not only understanding why people act, but leveraging such precious knowledge to help bring about a fair, just, and productive society.
Behavior analysis has explored the diverse palette of human behavior with some spectacular successes; most notably, the application of behavioral procedures to help people with autism spectrum disorders. For example, at the time of this writing, at least 46 states and the District of Columbia require insurance coverage for behavioral services for people with autism.
However, as Einstein’s previous quote reminds us, science shines a light on the stunning amount of information unknown to practitioners and researchers. Behavioral targets such as communication, social skills, and problem-solving demand tremendous amounts of future study.
Precision Teaching
Consumers of behavior analysis, as well as behavior analysts themselves, seek effective interventions. Future discoveries will occur in homes, clinics, and controlled settings as measurement systems improve. Indeed, the “history of science is largely coextensive with the history of measurement” (Tryon, 1991, p. 1).
The historical accounts of prolific discoveries in behavior analysis occurred exactly when Skinner used a standard visual display called the cumulative recorder to understand the nature of behavior. Skinner (1956) made his point by stating, “…we make important temporal aspects of behavior visible. Once this has happened our scientific practice is reduced to simple looking” (italics in the original, p. 229).
Skinner’s graduate student Ogden Lindsley understood the full implications of a standard visual display for humans. Lindsley created the Standard Celeration Chart or SCC and fostered a culture of precision, innovation, and dedication to improving human behavior.
When Lindsley created the SCC, he surrounded it by a measurement technology called Precision Teaching. Precision Teaching has a four-step process involving:
- Pinpointing a behavior target
- Counting and recording the behavior with dimensional quantities
- Displaying the data on a SCC and changing the intervention if the data warrant such a course of action
- Trying again or never giving up on the learner if the changes do not initially work
From the late 1960s until the present day Precision Teaching and the Standard Celeration Chart have largely developed in a paper medium. Several practitioners and researchers have introduced Excel-based templates and other statistical program driven charts (i.e., Statview) yet none found widespread adoption. Chartlytics, founded in 2014, serves as the exception.
Chartlytics digitizes not only the Standard Celeration Chart but other key features of Precision Teaching (e.g., pinpointing and recording dimensional quantities). Chartlytics democratizes Precision Teaching by offering an easy to use digital solution to anyone with an internet connection.
In May 2018, Chartlytics merged with the industry-leading practice management software company CentralReach. Now practitioners and researchers of behavior analysis have the unprecedented ability to recognize and implement Skinner’s focus on standard visualizations for human behavior. The union of Chartlytics and CentralReach ushers in a new era of Precision Teaching interfacing with behavior analysis at scale. The future will give rise to the following efficiencies and improvements.
Enhanced Measurement
Measurement lies at the core of every behavior analytic practice. A behavior analyst implementing a baseline condition or an active intervention will take data to determine what has transpired. At least three Precision Teaching practices enhance measurement and data collection leading to better data.
- Pinpointing. A pinpoint accurately describes a target by breaking down behavior into an action verb, an object receiving the action, and the context in which the behavior occurs. Example: Says greeting to peer.Individual behavior analysts working alone or in an organization apply greater precision to data targets with pinpoints. Pinpoints elucidate and facilitate understanding by specifically linking a behavior to an intervention. Less specific terms like “aggression” or “communication” could contain widely discrepant behaviors. Pinpoints allow behavior analysts to see exactly what behavior received an intervention. With thousands of pinpoints entering an electronic database, analysts will rapidly learn exactly how interventions affect specific behaviors.
- Dimensional quantities. Percentage correct typifies a dimensionless quantity. 100% can mean 3 out of 3 in 30 seconds or 3 out of 3 in 10 minutes. Furthermore, 100% could include 3 out of 3, 5 out of 5, or 20 out of 20. In all of the previous cases important information escapes the behavior analyst who tries to ascertain the most detailed data of a client’s performance.Precision Teaching and Chartlytics urge and enable dimensional measurement. Frequency (or rate), duration, latency, or count per day all yield quantifiable, representative units of measured behavior. With better information, behavior analysts will more clearly understand the effects of interventions leading to enhanced analysis and improved decision making.
Standard Celeration Charting. The following figure shows data on a linear graph and an SCC, respectively:
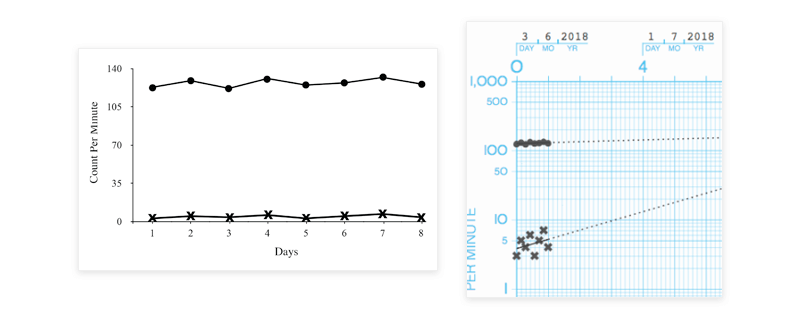
The data show starkly different trends for the X’s. The SCC has a specialized ratio scale that emphasizes rate of change. The SCC scaling leads to a different view of behavior, one that faithfully represents behavior changing proportionally rather than linearly. The advantages of proportional scales help behavior analysts:
- Reduce interpretative error and enhance pattern recognition
- Quantify behavior change with subsequent individual statistics for within and between condition analysis
- Accurately project future learning and behavior change
- Share metrics and actionable analytics (see below)
As more and more behavior analysts use the SCC a seachange will occur with how practitioners and researchers analyze, interpret, and communicate behavioral data. A standard view of behavior will place contemporary behavior analysts on the same footing as Skinner and his colleagues. Emergent pattern detection will flourish accelerating data discovery, innovation, and problem solving.
Behavioral Metrics and Analytics
Businesses thrive when they have access to critical customer metrics and analytics. In fact, no successful business can operate without metrics and analytics. Behavior analysis, however, has yet to fully embrace metrics or analytics.
Metrics refer to some standard of measure such as a count. For example, how often does a client engage in a particular behavior over a period of time? The metric would communicate to the behavior analyst the answer in a quantified metric.
On the other hand, analysts use information and logical analysis to answer specific questions. Determining whether or how much a client values a behavior analyst, would constitute an analytic. The information involving how much one person values or likes another could involve metrics (e.g., time spent in proximity to the person, number of conversations where client mentioned behavior analyst name, responses on preference assessment). The analytic aggregates and analyzes information enabling a deep level of data processing and insight.
Precision Teaching equips behavior analyst with advanced metrics and analytics. The steady flow of advanced data will elevate practice and analysis providing descriptive, diagnostic, predictive, and prescriptive analytics.
Internet of Things (IoT)
Precision Teaching strives to return to the directly observed, counted, and charted behavior patterns Skinner used to establish the science of behavior. The more closely the recorded data reflect the actual behavioral record, the higher the likelihood behavior analysts will understand the flow of events through time. The resulting outcome leads to an accurate and precise understanding of the behavior.
Today’s technology provides a platform for behavior analysts to simplify data collection while increasing the fidelity of data collection. Seemingly ubiquitous smartphones allow us to collect data in near real time as it occurs. However, phones and tablets may not always represent the best option, depending with whom or where behavior analysts work. Providing new data collection devices and apps will move the applied science closer to the cumulative recorder.
Conclusion
Behavior change showcases one of the most complex problems humans have. Many hidden environmental and biological variables play a role in why people do what they do. Yet applying scientific rigor and arming oneself with a full set of objective methods and processes heighten the capabilities of behavior analysts.
The digitization of Precision Teaching presents all champions of behavior change (e.g., behavior analysts, speech-language pathologists, occupational therapists, school psychologists) with a new set of measurement tools, individualized statistics, and analytical power.
At CentralReach we envision a field where all behavior change agents collect real time behavior data, receive immediate feedback on progress, and can marshal objective information to make effective, data-informed decisions.
Richard M. Kubina Jr., Ph.D., BCBA-D
Director of Research, CentralReach
David Stevens
Director of Chartlytics, a CentralReach Product
References
Skinner, B. F. (1956). A case history in scientific method. American Psychologist, 11, 221-233.
Tryon, W. W. (1991). Activity Measurement in Psychology and Medicine. New York, NY: Springer.