


Written by Rick Kubina
In the summer of 1975 the movie Jaws hit the theaters. Jaws told the story of an idyllic seaside community with a shark problem. The shark had an insatiable appetite that involved humans as the main course.
The iconic movie poster depicting the single-minded eating machine evoked a sense of dread. The open jaws of the massive shark swimming towards an unsuspecting swimmer foretold of a frightening outcome.
The well-known Jaws image entered the collective consciousness of the nation. Parodies, commercials, and even political cartoons made use of the open mouthed shark. And in 1977, teacher Pat All and her 7th grade class went on to use the imagery for a very different and productive purpose, one of the names of a “learning picture” (All, 1977).
Learning Pictures – A Precision Teaching Technique
Precision Teaching (PT) traces its roots back to B. F. Skinner. The founder of Precision Teaching, Ogden Lindsey, explained how PT inherited a standard visual display (the cumulative recorder which sparked the Standard Celeration Chart) and a universal dimensional quantity for behavior (rate or frequency).
Contemporary behavior analysis has become very popular as an applied method for helping people with autism spectrum disorders. However, PT began in earnest in public schools. Lindsley described how PT supercharged classroom learning:
High performance aims and custom-tailored prescriptions maximize learning. Least costly and most effective learning occurs with classroom performance timed, counted, and charted daily by the learners themselves. Least costly and most effective learning improvement changes occur with chart-based decisions made weekly by the learners and their teachers” (Lindsley, 1992, p. 51).
Students self-charted their own data and decided whether or not they needed help. A student could ask the teacher for a change or could come up with his or her own intervention and run it by the teacher.
The students became aware of their progress and when they needed help through “learning pictures” (also called behavior change pictures; Kubina & Yurich, 2012). The learning pictures emerged after the students charted corrects (acceleration data) and incorrects (deceleration data) on their Standard Celeration Charts.
Precision Teaching emphasized the measurement and monitoring of acceleration and deceleration behaviors at the same time. On one hand a behavior can have corrects and incorrects (called an accuracy pair). On the other, a behavior targeted for deceleration can have a corollary behavior set for deceleration (called a fair pair).
Figure 1 provides a recreation of Lindsley’s original 13 learning pictures. In the Figure, the arrow line symbolizes acceleration data (with dots) or deceleration data (with x’s) moving through time. The celeration line visually communicates the speed and direction of behavior change. The A (accel aim star) and inverted A (decel aim star) represent the aim or goal. And the blue horizontal dash depicts the time bar capturing the counting time or interval for observing and tallying the behavior (e.g., 1 minute).
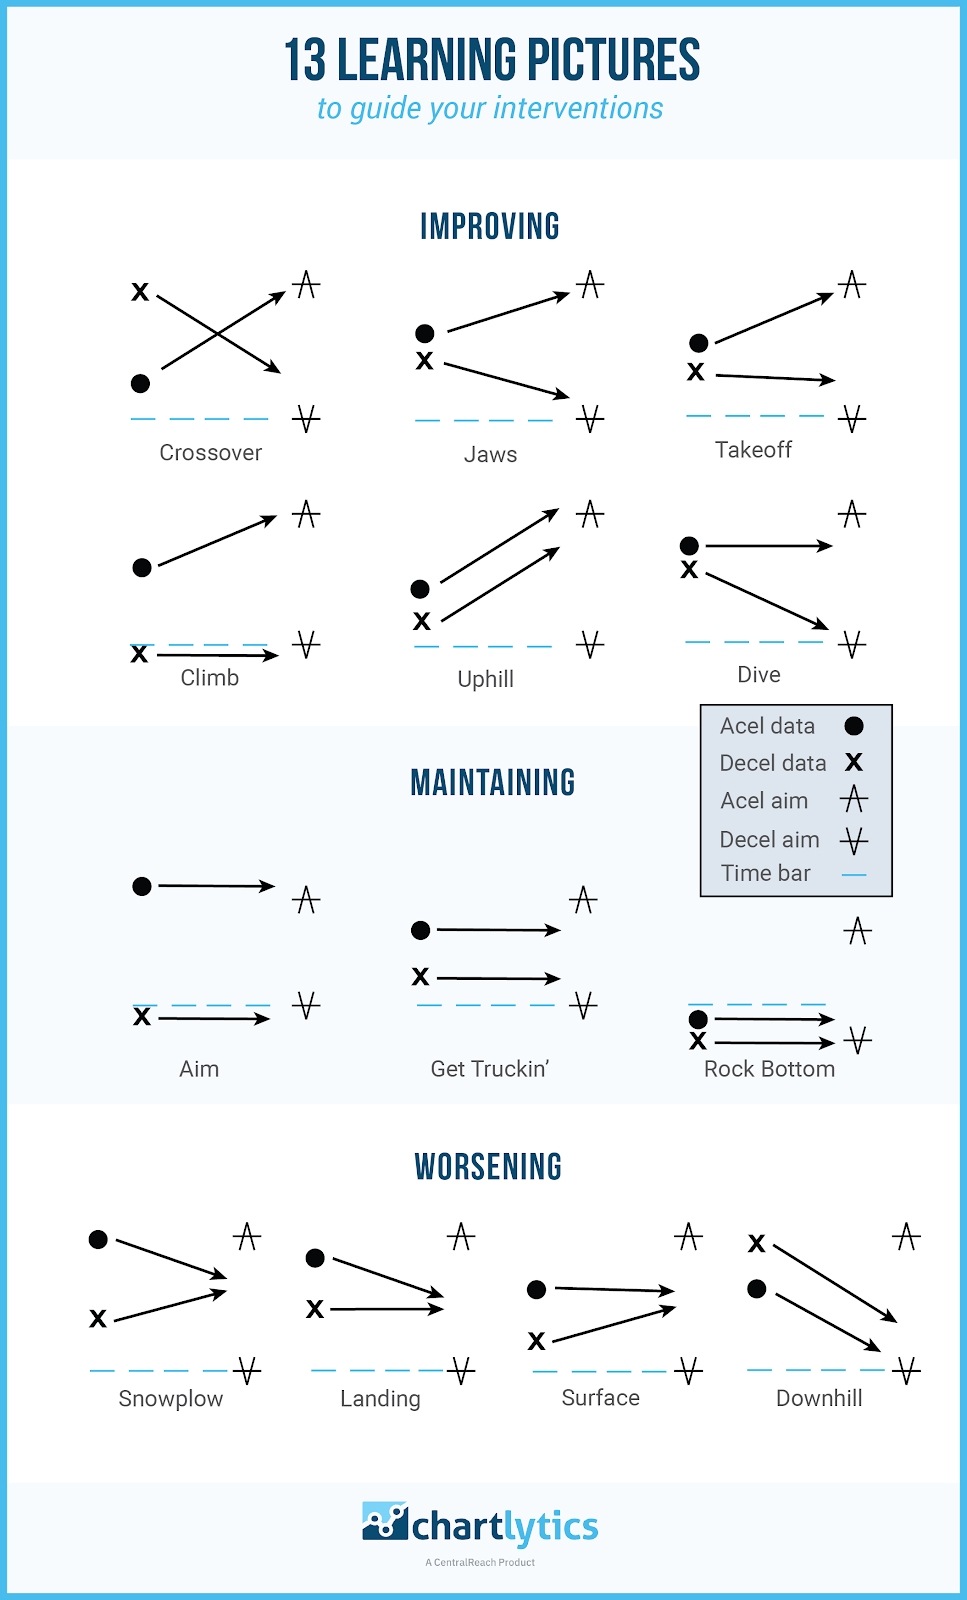
Figure 1. Learning pictures in three broad categories.
Three broad categories describe progress change. Behavior change can improve, worsen, or stay the same and maintain. Students with improving pictures continue their current program or intervention. Students with worsening pictures ask for help. And students with maintain learning pictures evoke different actions depending on where the behavior paths lie (discussed in detail later).
Lindsley described how the 7th grade students came up with the names in 1977.
The students named Jaws after the wide-open jaws of the shark famous in a thriller movie the prior summer. Snowplow, Uphill, and Downhill came from the positions of snow skis while skiing. In Climb, Takeoff and Landing the correct celeration line is the flight of an airplane and its related error line is the surface of the ground. In Surface and Dive the correct line is the surface of the sea, and the error line is the path of a submarine (Lindsley, 1990, p.13).
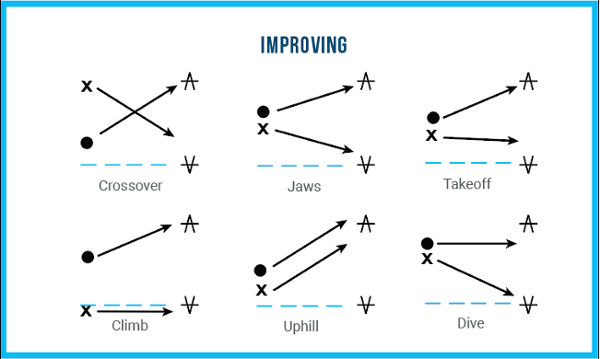
The first four improving pictures (Cross-over, Jaws, Take-off, Climb) have accel data growing and moving towards the accel aim. The decel data advance towards the decel aim or maintain. However, the fifth learning picture, Uphill, has decel data growing also. A teacher would monitor such a pattern because the growing decel data indicate the student learning the incorrect form for performing a skill or behavior.
The last improving learning picture, Dive, has decel data trending in the right direction and accel data flat. While the behavior technically has improved, the teacher must keep a watchful eye on the data to make sure the accel data moves upward towards the aim.
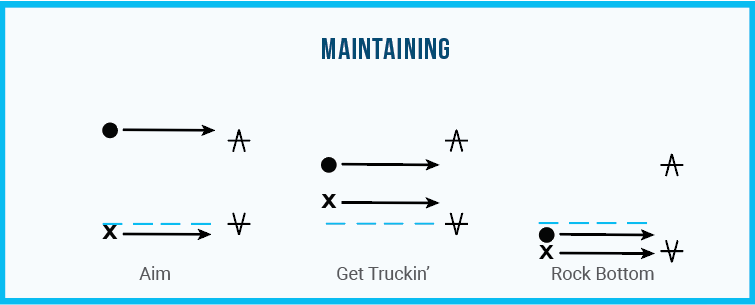
The maintaining learning pictures suggest two different responses/decisions. The aptly named “Aim” indicates the student’s performance has reached the aims for the accel and decel data. The goal shifts to maintaining the mastery condition across time.
On the other hand, Get Truckin’ and Rock Bottom propose the student do something different. The lack of learning in the middle of the chart for Get Truckin’ and the languishing performance for Rock Bottom reveal a problem. In both cases the direction of the accel and decel data point to a lack of progress.
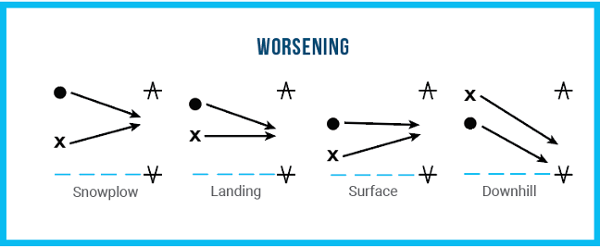
The worsening pictures expose a problem necessitating immediate remediation — namely, the deterioration of progress. In the case of the Snowplow, the student knew something but across time unlearned what he or she knew. A real snowplow signals relief for those who live with snow, but the Snowplow learning picture suggests the opposite!
Landing and Surface tell a similar story but in different ways. Landing shows a worsening condition as accel data decelerate but decel data maintain. Surface shows the accel data maintain but the decel data accelerate. In both cases the behavior change has degenerated across time.
The fourth worsening learning picture, Downhill, looks like what would happen if someone rolled a ball down a hill. The ball would descend and pick up speed. The Downhill learning picture demonstrates such an outcome. The decel data move downwards which speaks to a positive result. Yet the accel data follow the same path, a very unwelcome event.
All learning pictures help students, teachers, parents, behavior analysts, and anyone else on the behavior change team recognize key patterns. The visual evidence points to different states of progress: improving, worsening, or maintaining. And depending on what learning picture emerges, the teacher or responsible behavior change agent can make a decision more quickly and soundly.
Learning Pictures – The Past to the Present
At the time of this blog, learning pictures have turned 41 years old. The 7th graders who named the pictures would find themselves in their early 50s! The validity and utility of learning pictures, however, has not changed. Yet many new students and even practitioners might not appreciate the dated references to names such as Jaws and Get Truckin’.
The student names of the universal learning patterns may change, even though the patterns do not. For example, a new crop of students at the Haugland Learning Center, a charter school for students with an Autism, Asperger’s, or PDD-NOS diagnosis, came up with their own names for learning pictures (Guild, 2015). Some of the new names include Climbing the Mountain, Stuck in the Mud, Belly Up, and The Race.
The specific names of the learning pictures do not particularly matter. The effect of naming the specific patterns, however, do have real power. Naming learning pictures inspires confidence in the decision making process and leads to ownership of the charted data.
Conclusion
Learning pictures appear on a Standard Celeration Chart as a result of charting acceleration and deceleration data concurrently. In the 1970s students discovered the patterns that emerged helped them understand if they needed help or could continue to make progress. Naming the learning pictures had a practical application by facilitating decision making. More importantly, the students formed a community around learning showcased on a standard visual display.
While the previous section highlighted how learning pictures helped students, the same benefits hold true for behavior analysts and other behavior change agents working in a clinic or a home. The knowledge of learning pictures advances informed data monitoring, promotes data intimacy, and most importantly, improves decision making.
Richard M. Kubina Jr., Ph.D., BCBA-D
Director of Research, CentralReach
Professor, The Pennsylvania State University
References
All, P. (1977). From get truckin’ to jaws, students improve their learning picture. Unpublished master’s thesis, University of Kansas, Lawrence.
Guild, J. (2015, July). Accelerating classroom learning by teaching students how to use the standard celeration chart to efficiently collect, analyze, and select appropriate interventions based on their own performance data.Paper presented at the annual meeting of the Northeastern Federation for Precision Teaching, Pittsburgh, PA.
Kubina, R. M., & Yurich, K. K. L. (2012). The Precision Teaching Book.Lemont, PA: Greatness Achieved.
Lindsley, O. R., (1990b). Precision teaching: By teachers for children. Teaching Exceptional Children, 22(3), 10-15.
Lindsley, O. R., (1992). Precision teaching: Discoveries and effects. Journal of Applied Behavior Analysis, 25(1), 51-57.