


Written by Rick Kubina
Malcolm Gladwell wrote a book on the subject. Statisticians tell us they are a mistake. And a brewing company claims it as their namesake. You guessed it, we are talking about those strange things we call outliers.
The term “outlier” has different meanings depending on who does the defining. In statistics, an outlier refers to an observed data point very distant from the other observed data. Statisticians believe outliers can come from variability but also may result from a measurement error (many statisticians want to remove outliers from the data set). In geology, an outlier means a younger rock formation occurs with older rocks. And with people, an outlier describes a person excluded from a group. In statistics, geology, and people, an outlier represents something standing apart from the other usual, typical things.
In Precision Teaching, outliers also share aspects of distinct separateness. Specifically, outliers communicate exceptional performance. Outliers have two flavors: exceptionally high and exceptionally low. Thus, some use the terms highliers and lowliers to directly communicate what type of outlier has taken place.
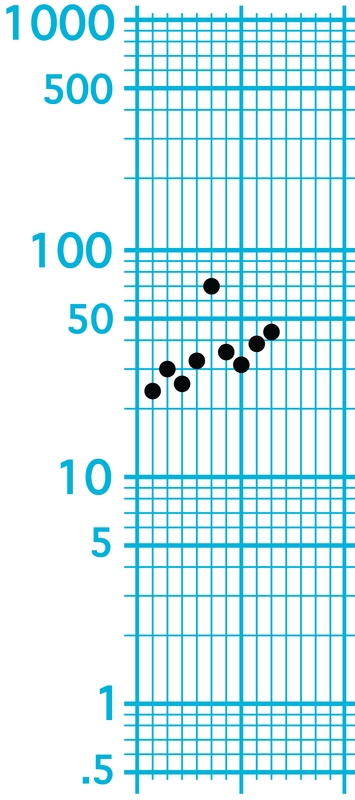
Ogden Lindsley, the founder of Precision Teaching, early on recognized the importance of outliers and used the whimsical names “peach” and “lemon” to describe very high and very low-performance frequencies. Looking at the figure below, can you spot the outlier?
What do outliers do?
If you see an outlier, welcome it to the fold. Outliers provide a superb opportunity to gather information. In the case of a highlier, we learn about the conditions that help usher in exceptionally positive change. Then, we gain insight into how we can help dramatically accelerate growth and learning.
When we see a lowlier we again acquire important knowledge— namely, what to avoid in the future. Lowliers show us conditions that negatively affect behavior. One day, we have a person learning like no one’s business. The next day, bam! Out-of-nowhere, the person has a terrible performance, one you have never seen before, and one you hope to never see again.
Outliers do not happen often, so when they do occur we must immediately investigate. True, some outliers can occur because a person committed a measurement error. Also, sometimes people enter in the data and miss a digit, making a performance look like an outlier. But true outliers do come to pass. And like a rare sighting of a comet, we must take notice and make swift inquiries into what happened.
The likelihood of outliers
If you have a checklist of all the awesome things you can do on a Standard Celeration Chart (SCC) you now have another entry. We can calculate the probability of an outlier occurring based on its distance from the bounce envelope.
What does probability tell us? Let’s say you found a $5.00 bill as you went for a walk around New York City. The probability of finding a $5.00 bill comes to 1 in 5,000. That means you have a 1 in 5,000 chance of finding a 5 spot. Your chance of a finding a gold bar in New York City comes to 1 in a 1,000,000,000,000 (1 trillion). You have a chance to find a $5.00 bill, you have almost no chance to find a gold bar lying around.
Probabilities tell us the same thing on the chart. If you have an outlier with a 1 in 1,000 chance of occurring you might not find that so unusual, it can occur though we would classify it as rare. But the more improbable the chance of that outlier occurring, the more we need to see why it happened. The figure below shows the distance a data point lies away from bounce envelope and the probabilities of it occurring.
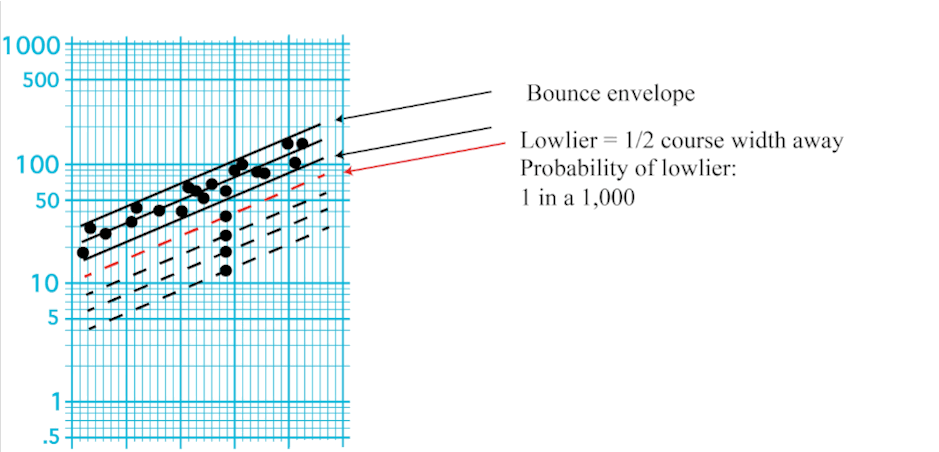
Figure 2. An animated gif showing how the distance away from the bounce envelope corresponds to the probability of occurrence for the outlier (lowlier). A course width is the size of the bounce envelope.
We have much to learn from outliers. When placed on the team with celeration and bounce, outliers give us that much more analytical power to understand behavior, solve problems, and create a potent, exciting learning environment.