


Written by Rick Kubina
When applying the scientific method, people will manipulate or observe variables. A “variable” refers to any factor a scientist can control, change, or measure in an experiment. Examples of variables include: a drug designed to cure strep throat, an exercise method geared towards helping people lose weight, and a reinforcement program used to improve students’ homework completion.
When a scientist applies a variable, the graphed data reflects the degree of change. A graph showing the data from an experiment will show different variables as “conditions.” Conditions show the presence or absence of variables. And conditions often occur in phases. So what’s the difference?
Rod doesn’t like to sit still
Let’s image we conducted an applied experiment with first grader Rod. Rod has a shock of red hair and an infectious personality. He’s the kind of kid we all love to hangout with. In class, Rod frequently stands up, stretches, or runs in place during circle time. Rod’s behavior distracts the other students (though some laugh) and causes the teacher Ms. Shubin to stop her instruction and prompt Rod to sit back down.
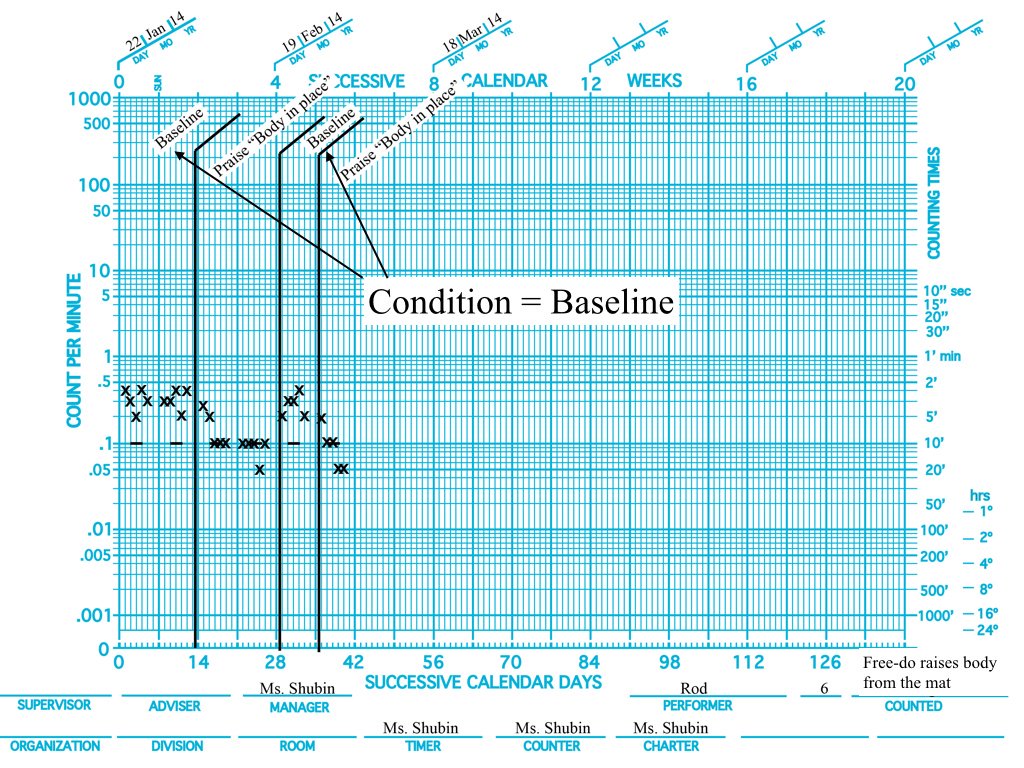
Ms. Shubin wants a change so she can teach Rod and the other students better during circle time. She decides to do an applied experiment. She has pinpointed Rod’s undesirable behavior as “free-do raises body from the mat.” Ms. Shubin wants to decelerate Rod’s behavior so she uses an X on the chart.
The Standard Celeration Chart exquisitely shows behavior change through time. In fact, Ms. Shubin believes no better chart exists for times series behavior. (We agree with her. Good call, Ms. Shubin!)
Notice the first condition in which Ms. Shubin counts, times, and records the pinpoint — baseline. Baseline does not mean Rod doesn’t do anything. Baseline indicates no special experimental arrangements have occurred with any of the recorded behavior. The baseline condition occurs twice as shown in the figure below.
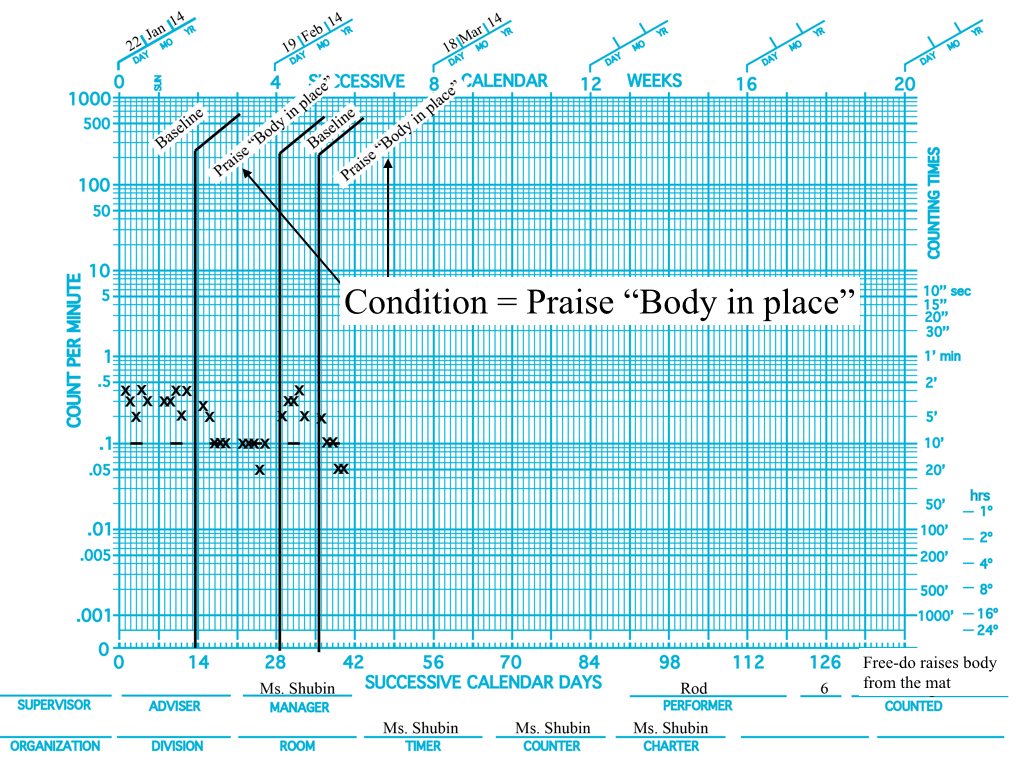
Ms. Shubin has implemented an intervention where she periodically praises Rod for times she observes him with his body placed on the mat. The intervention for praising Rod qualifies as a condition. Notice in the figure below the two instances in time where Ms. Shubin runs the intervention condition.
The applied study Ms. Shubin has run has two conditions, baseline and the intervention “Praise ‘Body in place.’”
Phases differ from conditions
The figure below shows four phases. A “phase” refers to a period of time. We can see in the first phase Rod did his thing during baseline. Then in the second phase Ms. Shubin brought her A game and ran a nice intervention. During the third phase Rod went back to baseline where no teacher intervention occurred. The fourth phase ushered in the intervention for a second time.
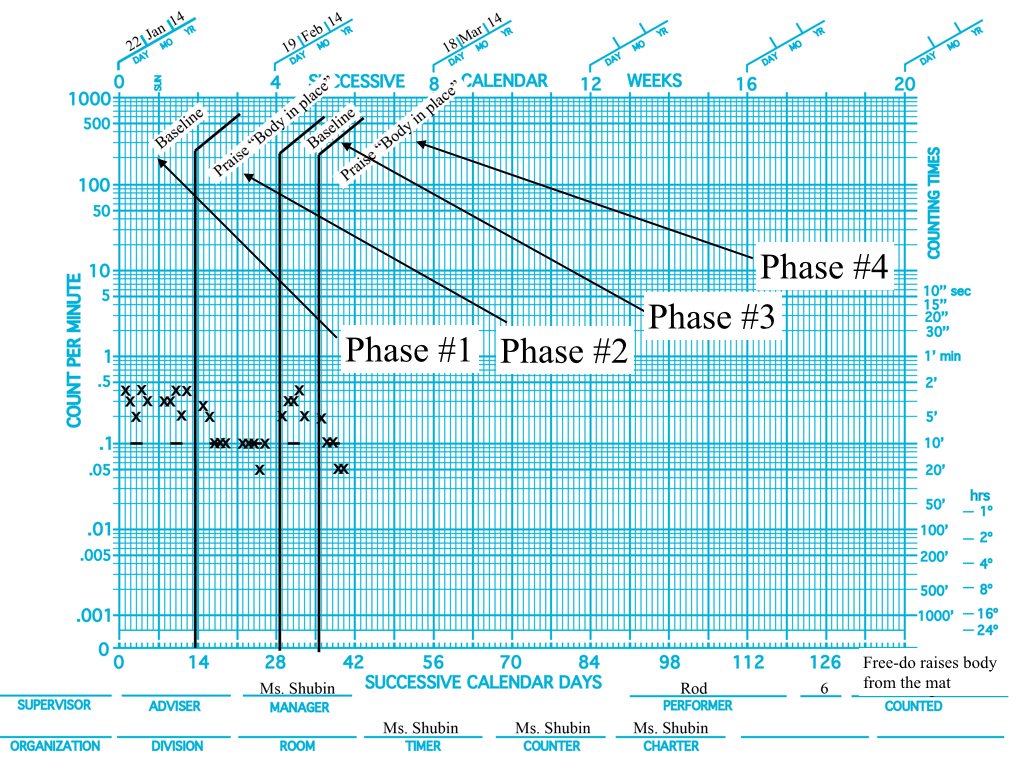
Phases differ from conditions. With phase change, we have periods of time, but with conditions, we have variables. Therefore, when doing a study we want to see what conditions the experimenter applies across time. The figure below shows the Condition Labels and the Condition Lines.

Condition labels tell us what has happened to the data under the label. When a new condition arrives, a condition line tells us we have a major change in effect.
People use the terms “phase change line” and “condition change line” synonymously. Should they? If we strive for technical adequacy, we will answer the previous question with a polite “no.”
A phase change line would mean we have switched to a new period of time, but a condition change line provides more information telling all chart readers a new condition has begun. Furthermore, the condition label informs the chart reader as to exactly what transpired. So we would not classify the use of the term phase change as wrong. Instead we should encourage “condition change” because it more aptly describes and informs the chart reader as to what has happened.